
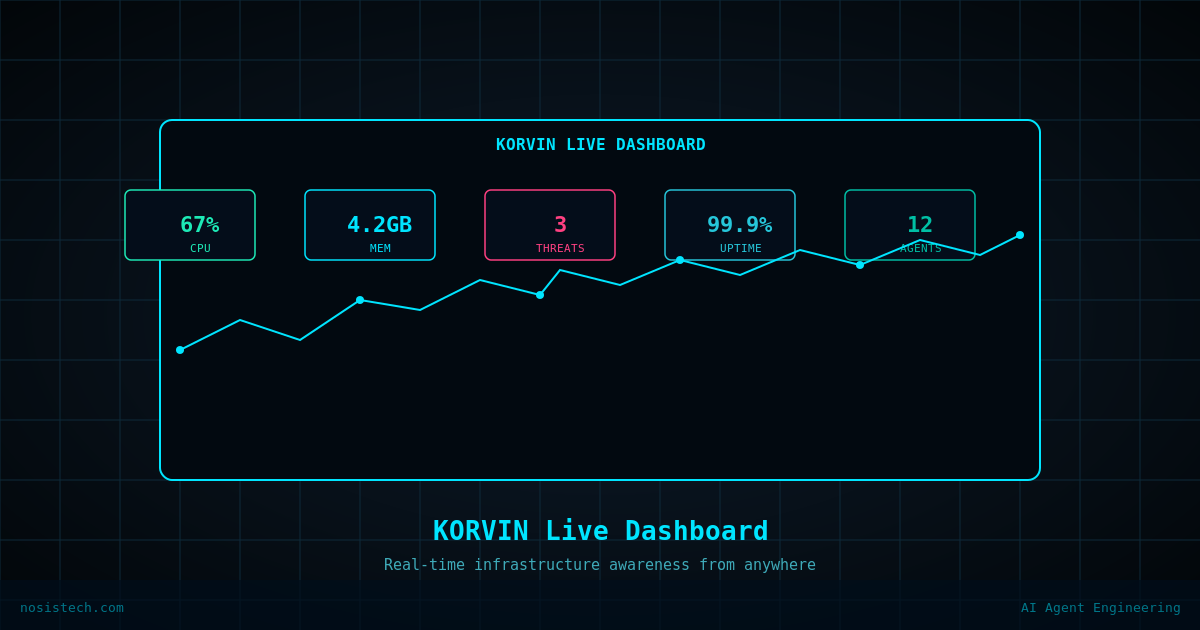
A personal AI security agent that shows you exactly what your infrastructure is doing, in real time, from any device — no terminal, no VPN, no technical overhead.
Disclaimer: This article documents a personal technical experiment on my own infrastructure. The configurations, rules, and steps described reflect what worked in my specific environment and should not be treated as security advice, professional recommendations, or guaranteed protection against any threat. Every environment is different. Always validate independently, test in a non-production setting first, and consult qualified security professionals before applying any security-related configuration to production systems. NosisTech LLC accepts no liability for outcomes resulting from use of this content.
Knowing what is happening inside your own infrastructure should not require opening a terminal, SSHing into a server, or running commands you have to look up every time. I built KORVIN’s dashboard because I wanted a single place to see exactly what my agent is doing, what my server resources look like, and whether everything is running, from my phone, my laptop, or anywhere else, without touching a command line.
What the Dashboard Shows Right Now
KORVIN’s dashboard is a lightweight web interface running as a service on my VPS, secured behind Cloudflare and accessible through a private URL from any browser. It is a prototype.
The current version displays real-time system resource data, disk usage, available storage, and RAM consumption. It shows KORVIN’s operational status at a glance: whether the agent is running, which AI model is active, whether voice processing is online, and whether persistent memory is active and the agent is responding correctly. A context window monitor shows how much of KORVIN’s active memory is in use at any given moment.
Everything is readable without technical knowledge. Numbers, status indicators, and progress bars, no raw output, no logs to parse, no commands to run.
What Is Being Built Next
The current dashboard is the foundation. What I am actively working toward is a full security operations view, dedicated panels for security scanning results and patch intelligence — what KORVIN has researched, what needs attention, and what has been resolved. The goal is a single interface where I can see not just whether KORVIN is running, but what it has found, what it has fixed, what needs attention, and what has been resolved.
Those capabilities are being built into KORVIN now, and the dashboard will expand as each one comes online.
Secured by Cloudflare
Making a personal dashboard accessible from anywhere without exposing your server is a security problem that needs to be solved correctly. KORVIN’s dashboard uses Cloudflare’s tunnel architecture, meaning the VPS never accepts direct inbound connections from the public internet. All traffic routes through Cloudflare’s network first and reaches the dashboard only through an encrypted local tunnel.
The result is no open ports, no exposed server IP, and no direct attack surface, while still being accessible from any device with a browser. Cloudflare handles DDoS protection, SSL, and traffic filtering automatically. It is the right architecture for this use case and it works without enterprise-level complexity or cost.
Platform Flexibility
KORVIN runs on whatever infrastructure you already have, a cloud VPS, a local machine, or both. There is no proprietary hosting requirement and no vendor dependency. The dashboard works the same way regardless of where the stack is deployed.
Current messaging integration is through Telegram. WhatsApp, Discord, and Signal are in active development. The architecture is modular, so new integrations come online without rebuilding the core agent.
Why This Matters
I built KORVIN because I wanted infrastructure visibility without the overhead of enterprise monitoring platforms and without needing to be a full-time engineer to operate it. The dashboard is the most visible expression of that goal, a clear, always-on view of what my agent is doing and how my infrastructure is holding up, accessible from anywhere, secured properly, and built on open-source components that anyone can run.
It is personal infrastructure, built for personal use, documented publicly so others can build something similar.